Anyone who has spent time developing Spark applications (or any other distributed application for that matter) has probably wished for some x-ray goggles into the black-box machinery of the framework. While Spark provides a nice and increasingly feature-rich UI for checking on the status of running tasks and even gives statistics on things like runtime, memory usage, disk I/O etc., there are other aspects of the runtime that can remain an annoying mystery: how is the JVM memory being utilized? How much memory is the driver using? What about garbage collection? As it turns out, all these are reported by Spark's metrics system: they're out there, you just need to grab them.
TL;DR: Gaining insight into your Spark applications by collecting Spark metrics with tools like Prometheus is
Unfortunately, the documentation regarding the metrics system is rather poor. If you also want to combine the Spark-reported metrics with those generated by Hadoop (YARN, HDFS), then you really embark on another google-powered goose chase for insights drawing on incomplete documentation pages and outdated blogs. I was inspired in this goose-chase by an excellent blog post showing a nice use of Spark metrics (the only one I could find, actually) and set off to do this for my own system. (there is another nice post about using Prometheus to monitor Spark Streaming, but using the JMX exporter instead of Graphite)
Goals
My main goals were two-fold:
- use metrics to better understand the JVM runtime of Spark applications
- combine spark, hadoop, and system-level metrics to complement performance benchmarks when making system architecture decisions
The first is somewhat obvious - tired of mysterious "Out of memory" exceptions, I want more fine-grained information about where, when, and why the problems arise. It is especially difficult to get any kind of information about off-heap memory usage and garbage collection by standard means in Spark and I want to rectify this situation.
The second is slightly more complex - we are running a 250+ node "test" Spark/Hadoop cluster on somewhat outdated hardware that is being used a sandbox before we purchase a modern state-of-the-art machine. Benchmarks like Terasort on Hadoop or the spark-perf test suite give you timing information but not very much data on what the system is actually doing. What are the raw disk I/O rates on individual nodes? Is the network being saturated? Is HDFS performance hampered by slow disks, network, cpu? When we run the same benchmark on a new system and get a (hopefully) improved time, which of these factors was most important and where could we perhaps downgrade components to save money without sacrificing performance? To answer these questions we really need instrumentation and monitoring.
Choices of monitoring backend and visualization
Graphite
The widely-adopted general-purpose monitoring choice seems to be Graphite. I found it pretty difficult to set up, owing to inconsistent documentation (for example, the top google hit for "graphite monitoring" takes you to outdated docs) and many components that need to play nice together. I spent a day configuring graphite/carbon and had a working system after some headache. When I needed to add Grafana on top of this, I quickly reached for a Vagrant VM setup that worked very well, but I didn't want to rely on a Vagrant image when I actually tried to deploy this later.
In addition, the built-in Graphite UI is fairly basic at best. The plotting is rather cumbersome and outdated, though I'm sure it's possible to set up nice dashboards with some effort. Still, it was very useful as an initial metrics browser, just to get a feeling for what is being reported.
Prometheus
A colleague pointed me to Prometheus which on the other hand took me about five seconds to get running. No database/apache configurations needed. Just download the appropriate release and go. Alternatively, you can run it easily via docker.
As an added bonus, I liked a few features of Prometheus that I hadn't really thought about before trying Graphite:
The data model
The data model allows you to define metrics which are more like "metric containers" and give them fine-grained specifications using "labels". In essense, the labels are the "dimensions" of each metric. For example, your metric might be "latency" and your labels would be "hostname" and "operating_system". You can then easily look at aggregate statistics on "latency" or drill down seamlessly to get stats per host or per os. Pretty nice.
The Query Language
This is intimately tied to the data model, but Prometheus comes with a pretty nice query language. Of course you have to learn a few things about the syntax, but once you do it's pretty easy to use and has some nice features that allow you to take advantage of the multi-dimensionality of the metrics.
Scraping vs. pushing metrics
With Prometheus you have to define endpoints that it will "scrape" -- it doesn't get any data automatically and clients can't push data to it. This is nice if you want some control over potentially noisy sources. You don't have to alter the source, you can just stop scraping it for input temporarily.
Grafana
I haven't experimented very much with the visualization front-end but went straight for Grafana. It was designed to be used with Graphite, but it is now possible to seamlessly insert Prometheus as a data source. Grafana looks good, has nice functionality, and seems fairly general so it seemed like a pretty safe choice.
Connecting Spark with Prometheus
Note: Before you continue here, make sure your Prometheus instance is running and you can reach it at http://localhost:9090 or whatever other port you configured.
Spark doesn't have Prometheus as one of the pre-packaged sinks - so the strategy here is to ask Spark to export Graphite metrics and feed those into Prometheus via an exporter plugin. To report metrics to Graphite, you must set up metrics via a metrics.properties file. You can put this in $SPARK_HOME/config or pass it to spark on the command line by using --conf spark.metrics.conf=/path/to/metrics/file - beware that this path must either exist on all executors. Alternatively you can pass the file to the executors using the --file flag.
My metrics.properties looks like this:
*.sink.graphite.class=org.apache.spark.metrics.sink.GraphiteSink
*.sink.graphite.host=<metrics_hostname>
*.sink.graphite.port=<metrics_port>
*.sink.graphite.period=5
*.sink.graphite.unit=seconds

# Enable jvm source for instance master, worker, driver and executor
master.source.jvm.class=org.apache.spark.metrics.source.JvmSource

worker.source.jvm.class=org.apache.spark.metrics.source.JvmSource

driver.source.jvm.class=org.apache.spark.metrics.source.JvmSource

executor.source.jvm.class=org.apache.spark.metrics.source.JvmSource
Spark's monitoring sinks include Graphite, but not Prometheus. Luckily it's really easy to get Graphite data into Prometheus using the Graphite Exporter, which you can easily get running either by building from source or using the Docker image. Once it's up, all you need to do is change the port to which your Graphite clients (i.e. Spark in this case) are sending their metrics and you're set -- the default port is 9109 so make sure you set that in your metrics.properties file.
You can go to http://localhost:9108/metrics once the exporter is running to see which metrics it has collected - initially it will only have some internal metrics. To get spark metrics in there, make sure you set up the metrics.properties file and try running the spark pi example:
$ $SPARK_HOME/bin/spark-submit --master local[*] $SPARK_HOME/examples/src/main/python/pi.py 500
On the http://localhost:9108/metrics you should now see a ton of lines like this:
# HELP local_driver_jvm_heap_init Graphite metric local.driver.jvm.heap.init
# TYPE local_driver_jvm_heap_init gauge
local_driver_jvm_heap_init 1.073741824e+09
# HELP local_driver_jvm_heap_max Graphite metric local-1450274266632.driver.jvm.heap.max
# TYPE local_driver_jvm_heap_max gauge
local_driver_jvm_heap_max 1.029177344e+09
# HELP local_driver_jvm_heap_usage Graphite metric local-1450274266632.driver.jvm.heap.usage
# TYPE local_driver_jvm_heap_usage gauge
local_driver_jvm_heap_usage 0.35
# HELP local_driver_jvm_heap_used Graphite metric local-1450274266632.driver.jvm.heap.used
# TYPE local_driver_jvm_heap_used gauge
local_driver_jvm_heap_used 3.60397752e+08
This is showing us that the Graphite exporter to Prometheus works, but by default all Graphite metrics are sent across just as 1D metrics to Prometheus, i.e. without any label dimensions. To get the data into the Prometheus data model, we have to set up a mapping.
Mapping Spark's Graphite metrics to Prometheus
The one trick here is that if you just send raw Graphite metrics to Prometheus, you will not be able to use the nice Prometheus query language to its fullest because the metrics data will not have labels.
You can easily define mappings to turn these into proper Prometheus labeled metrics by specifying a mapping config file. Turning these JVM memory metrics into Prometheus metrics can be done with something like this:
*.*.jvm.*.*
name="jvm_memory_usage"
application="$1"
executor_id="$2"
mem_type="$3"
qty="$4"
This instructs the exporter to create a metric named jvm_memory_usage with labels application, executor_id, mem_type, and qty. After we restart the exporter with
host:~/graphite_exporter rok$ ./graphite_exporter -graphite.mapping-config graphite_exporter_mapping
and rerun the spark pi example, the metrics now look like this:
jvm_memory_usage{application="application_ID",executor_id="1",mem_type="non-heap",qty="committed"} 3.76832e+07
Great, now we can actually use Prometheus queries on our data!
Here is my full graphite exporter mappings file that will turn Spark Graphite metrics into something usable in Prometheus:
*.*.executor.filesystem.*.*
name="filesystem_usage"
application="$1"
executor_id="$2"
fs_type="$3"
qty="$4"

*.*.jvm.*.*
name="jvm_memory_usage"
application="$1"
executor_id="$2"
mem_type="$3"
qty="$4"

*.*.jvm.pools.*.*
name="jvm_memory_pools"
application="$1"
executor_id="$2"
mem_type="$3"
qty="$4"

*.*.executor.threadpool.*
name="executor_tasks"
application="$1"
executor_id="$2"
qty="$3"

*.*.BlockManager.*.*
name="block_manager"
application="$1"
executor_id="$2"
type="$3"
qty="$4"

DAGScheduler.*.*
name="DAG_scheduler"
type="$1"
qty="$2"
Exploring metrics in Prometheus
To actually see our Spark metrics in Prometheus, we need to tell it to scrape the graphite exporter for data. We do this by adding a job to prometheus.yml below the internal prometheus job declaration:
...

scrape_configs:

...

  - job_name: 'spark'

    target_groups:
      - targets: ['localhost:9108']
Now restart Prometheus (if it was running already) and it should start collecting metrics from the exporter. Rerun the spark pi example to get some metrics collected.
Prometheus comes with a simple web UI that should be accessible on http://localhost:9090. This allows you to try out some queries, for example you can enter this query:
jvm_memory_usage{executor_id='driver', qty='used', application="local-1450275288942"}
but replace the application identifier with your actual application ID and see the values reported back in the "Console" tab or the plot.
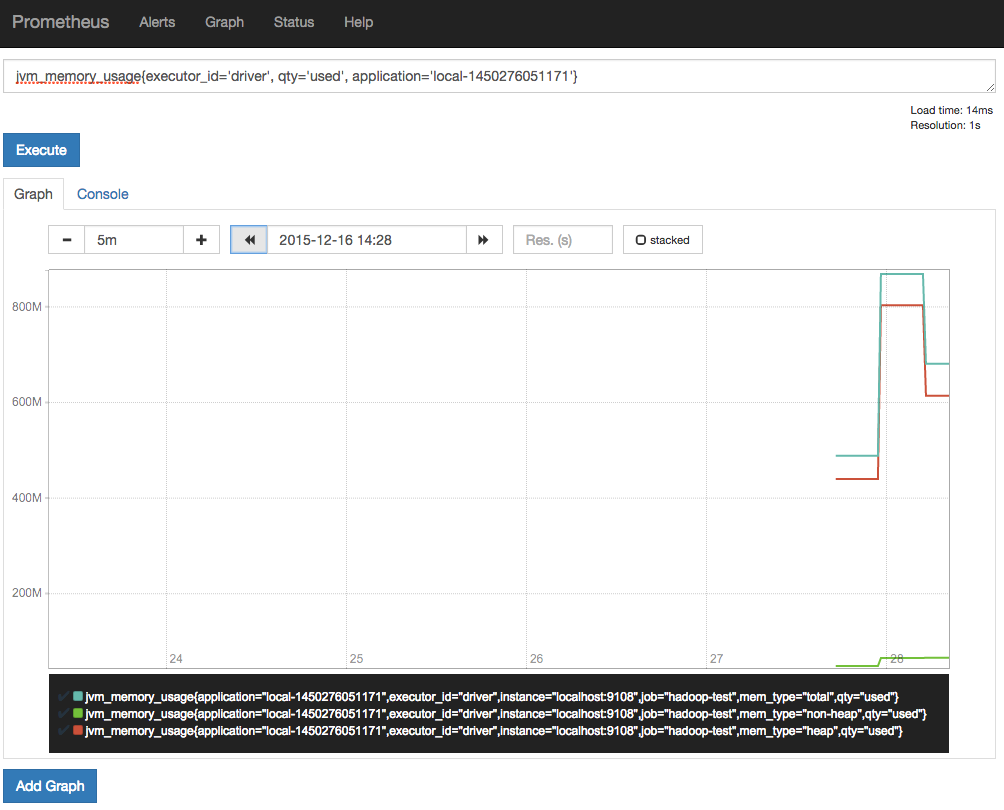
This is nice to get a first look at your data, but for some sort of user-friendly metrics tracking, we'll want to set up Grafana.
Using Grafana to Visualize Spark metrics via Prometheus
First, download Grafana or use their Docker container. I found that the build was breaking in ways I wasn't able to debug very quickly so I resorted to using the Docker container for the purposes of testing.
Once Grafana is running, set up the Prometheus data source:
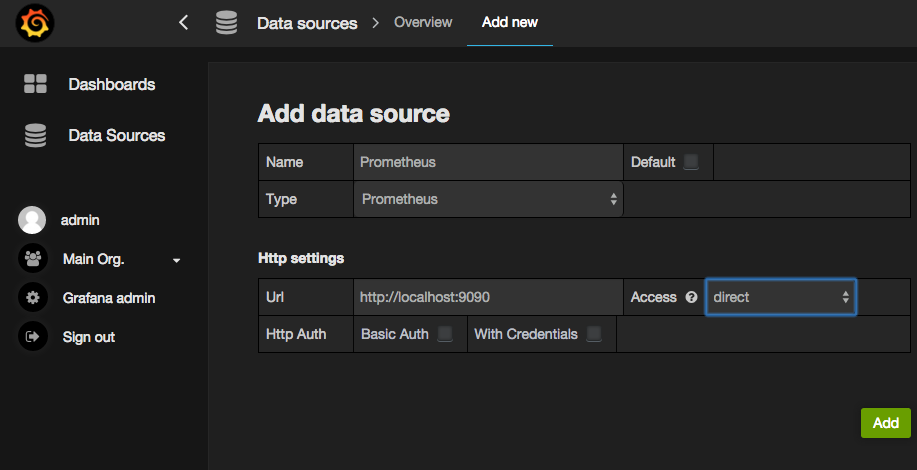
Now you are ready to set up some Grafana dashboards! When adding plots, just select the "Prometheus" data source in the bottom right and enter a query. Here's an example:
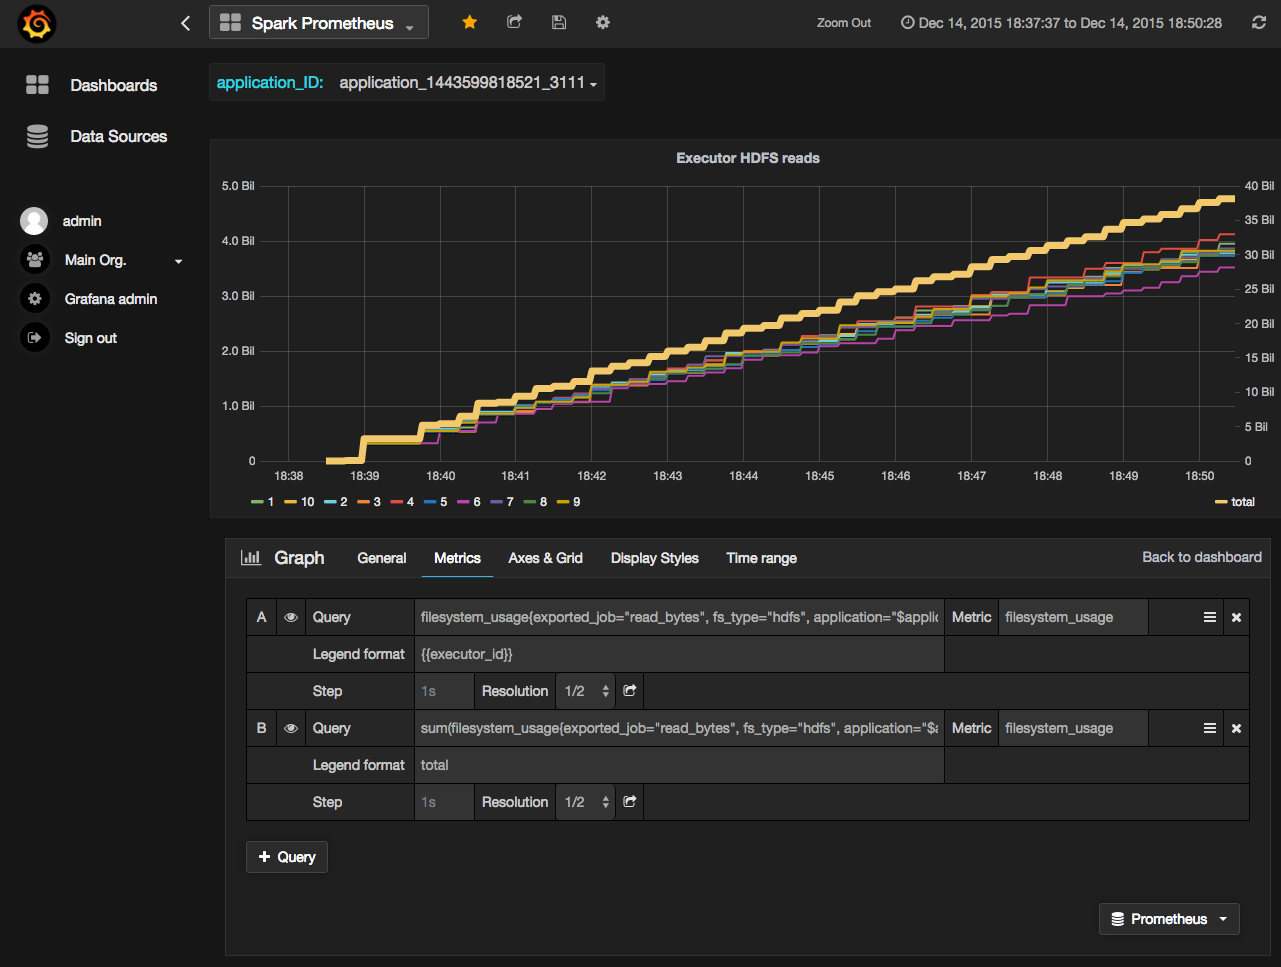
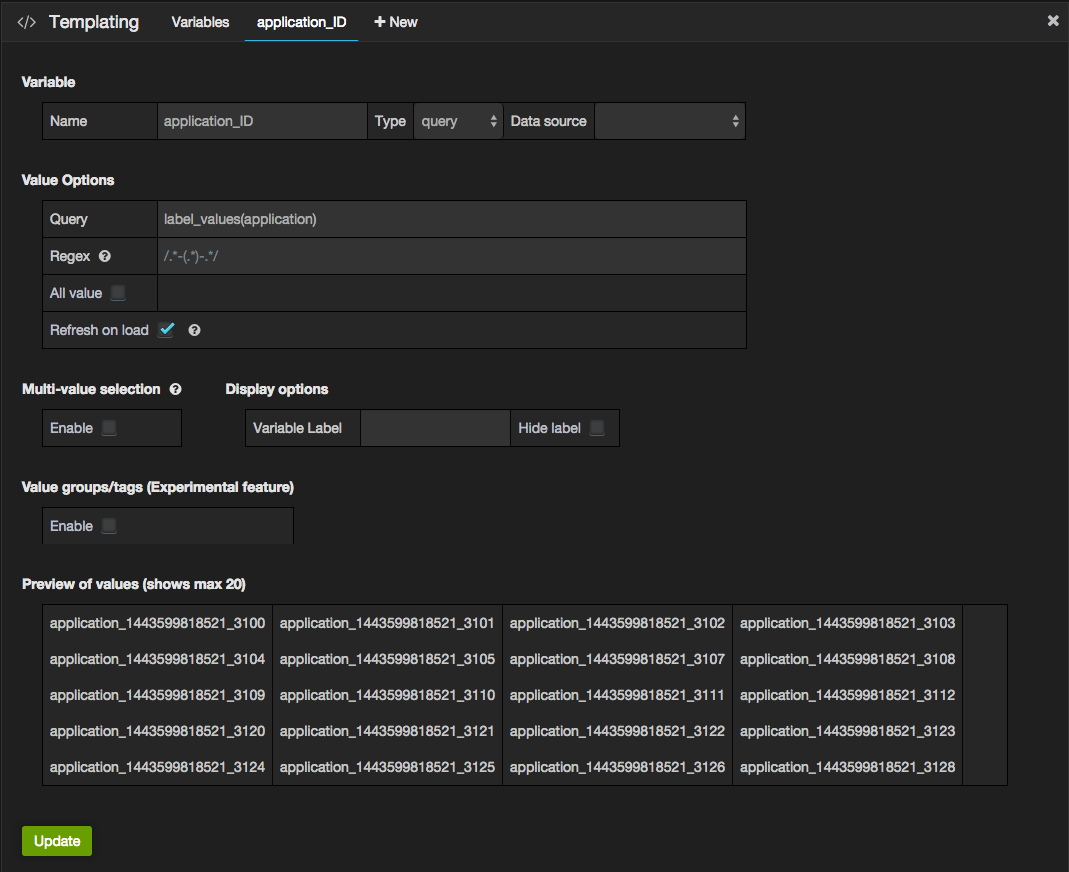
In this example I'm using a template variable "application_ID" so that I can easily select the application I want. To define your own, go to the "templating" settings:
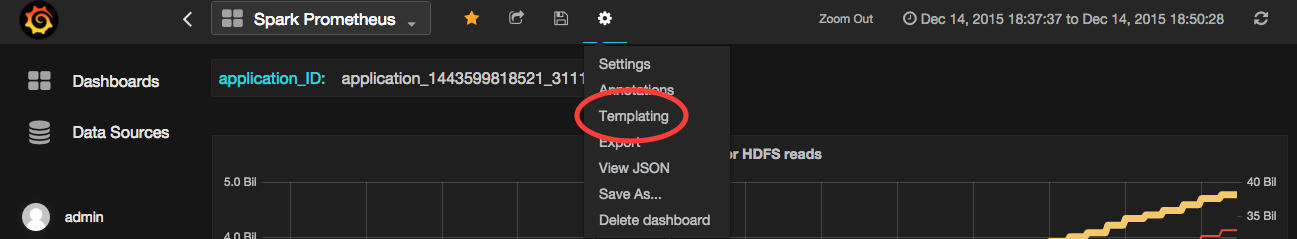
See the Grafana Prometheus documentation for more information.
Finally, a complete dashboard for a single Spark application showing some individual and aggregate Spark metrics may look like this:
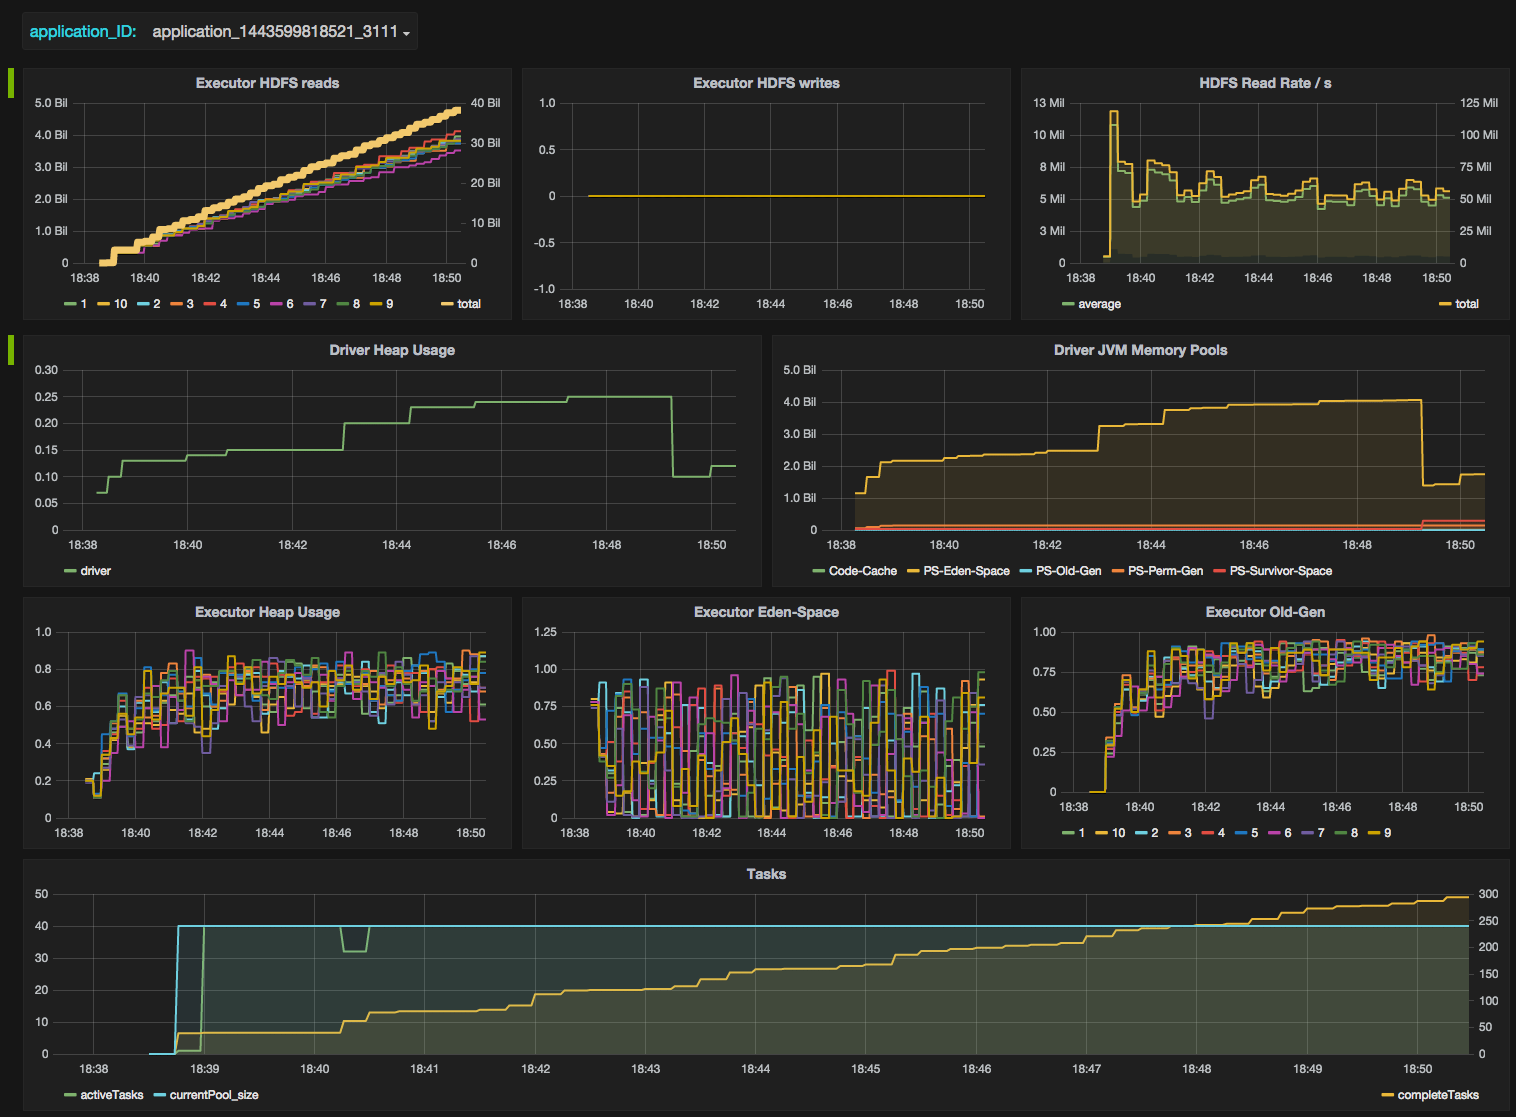
You can play with the full snapshot here.
If you want to use this dashboard as a template, you can grab the JSON and import it in your own Grafana instance.
Conclusion
This is just the beginning of Spark/Prometheus/Grafana integration - next is obviously the collection of Hadoop and system-level metrics. More on this in the next post.
Comments
comments powered by Disqus